fastai - Lesson 2 - Deep Learning for Coders (2020)
Notes taken from the Deep Learning for Coders (2020) - Lesson 2 video
Notes taken from watching the Lesson 2 - Deep Learning for Coders (2020) video.
00:00:00 - Recap
- Last lesson:
- Trained first model
- Learned what Machine Learning is and how it works
- Fundamental limits of ML
- Tody
- Finish Chapter 1
- Get models into prod and talk about the sorts of issues you might have
- 2 notebooks reminder:
- fastbook repo with prose from notes
- course v4 repo with everything stripped for running yourself
00:02:55 - Classification vs Regression
- If predicting class (ie which breed of dog, whether a user is likely to default or not), it's called: Classification
- Value is discrete
- If prediction continuous value (ie age of person), it's called: Regression
- Sometimes people use regression as short-hand for linear regression model, but that's incorrect
00:04:50 - valid_pct
valid_pct- Get 20% of data and put aside for validation (test whether Overfitting)
00:05:44 - Learner
- A Python object that contains:
- your data
- the architecture you're optimising
- the metric for testing performance on validation set
- Epoch
- The name for a full pass over a dataset
00:06:44 - Audience question: Metrics vs loss function
- Metric = function used for telling us how well the model is performing
- Loss func = function the model uses during optimisation
00:09:07 - Overfitting revisited
- Overfitting = key thing ML is about
- How well does model do on data it hasn't seen?
- Or is model simply "cheating" and memorising the training set.
- Test set
- Even with a valid set, you can overfit through repeated hyperparameter tuning.
- Perhaps you found a configuration that happens to work on this validation set
- Test set addresses this
- If you are using a vendor to build a model, you should own the test set
00:12:09 - Choosing val and test set
- Usually random set is okay, except in certain cases
- Time series, you should use a time in the future for validation and the future from that for test
- The point of the model is to use the past to predict the future. How well does it do at that?
00:13:57 - Question: isn't overfitting when train loss falls below valid loss?
- Only thing that matters is how well model performs on validation set and test set
00:15:56 - Transfer learning
- Transfer Learning is about taking a pre-trained model and repurposing it on a different dataset
- Fine-Tuning is what we do to enable transfer learning
- Intuition is that concepts about images are already learned by models and therefore can be reused:
- It's a key focus for fastai library.
00:19:04 - Audience question (see metric vs loss)
00:21:50 - Fine tuning
- Transfer learning technique where params of pretrained models are updated for more epochs
- Steps when calling
fine_tune(epochs)in fastai:- Adds a new "head" (the final layer) to model which starts out random.
- Use an epoch to train only head until it's no longer random.
- Use epochs that are passed in to fit entire model.
- The head is trained faster than the rest of the model.
- Adds a new "head" (the final layer) to model which starts out random.
- Steps when calling
00:22:53 - Why does transfer learning work?
-
Paper Visualizing and Understanding Convolutional Networks by Zeiler and Fergus
- Developed a technique for visualising what a CNN is doing
- Visualisation sometimes key to building a great model
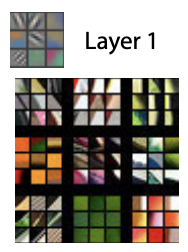
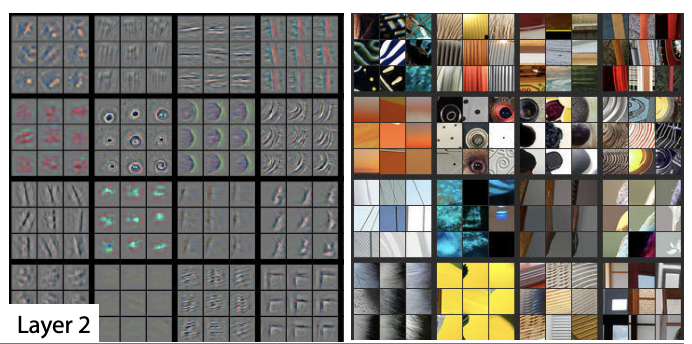
- Used AlexNet since it's only a 7-layer model
- Visualised 9 features from each layer, then found patches from specific examples of images that matched the filter
-
Layer 1
-
Finds lines, gradients etc
-
-
Layer 2
-
Combines filters from layer 1 to start to learn shapes, textures etc
-
-
Layer 3 and up
- Learning more concrete things like petals, faces etc
- The insights in this paper help understand how transfer learning works:
- Earlier layer learn much more abstract features, so it makes sense they can be repurposed.
- Developed a technique for visualising what a CNN is doing
00:28:48 - Other applications for vision techniques
- Sounds can be turned into pictures using Mel spectograms
- Splunk created pictures of user's mouse behaviour for fraud detection
- Malware binary file can be represented as image, see Malware Classification with Deep Convolutional Neural Networks by Mahmoud Kalash et al.
00:31:20 - Terms to know
- Label - Dependant variables - the thing that says what each datapoint is
- Architecture - the function that makes predictions, whose parameters can be trained
- Model - the combination of architecture and params
- Fit - update params of model to do better at a task
- Train - synonym of fit
- Pretrained model - model that has been trained on another dataset
- Fine tune - retrain model on new dataset
- Epoch - complete pass through dataset
- Loss - used for loss function to measure of how good model is
- Metric - used by people to measure how good model is
- Validation set - used to evaluate model's ability to generalise
- Training set - uesd to fit model
- Overfitting - when model "cheats" and memorises the training set and therefore performs poorly on val set
- CNN - convolutional neural network - a type of architecture
00:31:53 - Arthur Samuel's approach revisited
00:32:34 - End Chapter 1
- Try to answer questionaire to test knowledge
- See further research for stuff that isn't covered in the book
00:34:25 - Audience questions
- Do models get worse at their original job when fine tuned?
- Yes. It will no longer be good at original job when fine tuned. To keep it good at new and old task, have to include data from both sets.
- Known in literature as catastrophic forgetting.
- What's the difference between params and hyperparams?
- Params are things that model learns
- Hyperparams are config values you set
- What pretrained models are available?
- Search Model Zoo or Pretrained weights for examples
- Could be more pretrained models out there
00:41:20 - State of Deep Learning
- DL not always best choice for tabular data.
- Works best with high-cardinality data like postcodes and product ids
- Bad at conversation
- Good at saying stuff that sounds like conversation
- Collab filtering
- DL creates predictions, not necessarily recommendations
- Multi-moadal
- Can put captions on photos, but struggles with accuracy
00:44:32 - Recommendation vs Prediction
- Example from Amazon's recommendation engine.
- Recommends Jeremy other Terry Pratchet books, because he read one.
- Not useful since he's read Terry Pratcher, but it makes sense as a prediction.
00:45:51 - Interpreting models and the drawbacks of p-values
- Case study: model in Impact of Temperature and Relative Humidity on the Transmission of COVID-19: A Modeling Study in China and the United States (note: paper's title changed since fastai video was release)
-
Paper used a random sample of 100 cities in China for modelling the relationship between humidity and R
- R is measure of transmissibility: R < 1 = won't spread, R > 1 = spread quickly
-
They included this chart, which plots a best-fit line to claim relationship:
R = 1.99 - 0.023 * Temperature![Humidity vs r0 chart][/_media/humidity-vs-r0-fastai.png]
-
Since the dataset is small, could just be a random chance.
- To be more confident, you'd need to look at more cities
- One way to measure "confidence" with p-value
- To be more confident, you'd need to look at more cities
- p-value
- High-level overview:
- Start out with null hypothesis: for example, no relationship between temperature and R
- Get data of independent (temperature) and dependent (R)
-
Ask: what % of time would we see relationship by chance under null hypothesis?
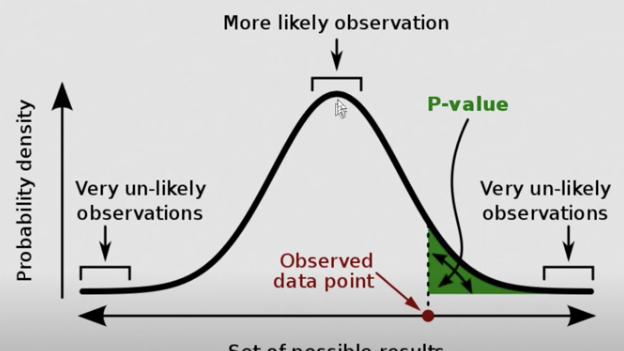
- Example from paper: null hypothesis is line of best-fit has a slope of 0 * Most papers report on p-value
- American Statistical Association includes lots of caveats for p-value
- "P-values do not measure probability studied hypothesis is true, or the data was produced by random chance alone"
- Frank Harrell: "Null hypothesis testing and p-values have done signficant harm to science"
- Biggest statistical error people make:
- see p-value not < 0.05 and conclude no relationship exists
- Biggest statistical error people make:
- Could simply be that you don't have enough data
- How to check: use opposite null hypothesis (there is relationship between R and temp) and see if you have enough data. If not, then you don't have enough data full stop
- Turns out, the graph in the paper shows a Univariate Relationship relationship between temp and R, since it's easier to visualise
- However, in the paper they did a Multivariate Relationship model including Temperature, Relative Humidity, GDP per Capita, Population Density in the model
- Turns out, the graph in the paper shows a Univariate Relationship relationship between temp and R, since it's easier to visualise
- Therefore can be more confident in your results
- Intuition: if all those values were the different but temp was the same, there still would be relationship
- p-value does not tell if practically important, however, the model does seem to be important: 2 cities with different climates but is the same in every other way, would have very different R results:
-
01:02:48 - How do you make predictive model useful? Drivetrain approach
- Jeremy's paper with Margit Zwemer and Mike Loukides: Designing Great Data Products
- In it, developed an approach to taking actions to model called Drivetrain Approach.
- Example:
- Objective: how do I maximise 5 year profit?
- Lever: what inputs can we control?
- Data: what data do we collect?
- Models: what levers influence the objective?
- At the time it was written, insurance companies were using predictive model to simply likelihood of crashing car, then adding 20%
- Example:
- See appendix of book for more
- In it, developed an approach to taking actions to model called Drivetrain Approach.
01:08:00 - How should people think about relationship between seasonality and Covid?
- The paper is an example of how complicated and uncertain models are in practise.
- The usefulness may be in that it's added some more information to our prior beliefs about the spread of disease
01:14:00 - Training and saving a model
In the example below, I pulled an image dataset off Kaggle about fruit. In the course, Jeremy details an example of using Bing image search to find your own images. Seems like a lot of hassle.
from fastai.vision.all import *
im = Image.open('../input/fruit-images-for-object-detection/train_zip/train/apple_1.jpg')
im.to_thumb(128, 128)

fms = get_image_files('../input/fruit-images-for-object-detection/train_zip/train/')
fms
(#240) [Path('../input/fruit-images-for-object-detection/train_zip/train/banana_68.jpg'),Path('../input/fruit-images-for-object-detection/train_zip/train/apple_46.jpg'),Path('../input/fruit-images-for-object-detection/train_zip/train/orange_20.jpg'),Path('../input/fruit-images-for-object-detection/train_zip/train/mixed_1.jpg'),Path('../input/fruit-images-for-object-detection/train_zip/train/apple_68.jpg'),Path('../input/fruit-images-for-object-detection/train_zip/train/banana_31.jpg'),Path('../input/fruit-images-for-object-detection/train_zip/train/orange_28.jpg'),Path('../input/fruit-images-for-object-detection/train_zip/train/apple_38.jpg'),Path('../input/fruit-images-for-object-detection/train_zip/train/apple_62.jpg'),Path('../input/fruit-images-for-object-detection/train_zip/train/apple_21.jpg')...]
verify_images is used to validate the images aren't correct
verify_images
<function fastai.vision.utils.verify_images(fns)>
failed = verify_images(fms)
failed
(#0) []
Have to tell fastai the data you have and how it's structured.
Used a factory method in Lesson 1. Now using a more flexible way to use data in whatever format you want.
01:21:46 - Datablock API
- blocks - tell Fast.ai what your dependant and independant variables are.
- get_items - how do you get a file of all the file names?
- splitter - how do you split the data into validation and training set?
- get_y - how do you get the labels for each train image?
- item_tfms - what transforms should be run on each image?
Order of functions as follows:
- get_items
- get_x, get_y (no get_x in this example)
- blocks[0].create, blocks[1].create
- item_tfms
- Splitter (spins into train and val)
- Collate (DataLoader)
- batch_tfms - not used in example below

def label_func(label):
    """Get label from prefix of filename.

    apple_46.jpg -> apple
    """
    return label.name.split('_')[-2]

fruit = DataBlock(
    blocks=(ImageBlock, CategoryBlock),
    get_items=get_image_files,
    splitter=RandomSplitter(valid_pct=0.2, seed=420),
    get_y=label_func,
    item_tfms=Resize(128)
)
path = '../input/fruit-images-for-object-detection/train_zip/train'
dls = fruit.dataloaders(path)
dls
<fastai.data.core.DataLoaders at 0x7f740629c7d0>
01:24:58 - DataLoaders
Now have an instance of a dataloaders, which has a validation and training dataloader.
A dataloader grabs a few (batch) of items and puts them on the GPU.
dls.show_batch(max_n=4, nrows=1)
/opt/conda/lib/python3.7/site-packages/PIL/Image.py:961: UserWarning: Palette images with Transparency expressed in bytes should be converted to RGBA images
  "Palette images with Transparency expressed in bytes should be "

fruit = fruit.new(
    item_tfms=RandomResizedCrop(244, min_scale=0.5),
    batch_tfms=aug_transforms()
)

dls = fruit.dataloaders(path)
learn = cnn_learner(dls, resnet18, metrics=error_rate)
Downloading: "https://download.pytorch.org/models/resnet18-5c106cde.pth" to /root/.cache/torch/hub/checkpoints/resnet18-5c106cde.pth
learn.fine_tune(8)
| epoch | train_loss | valid_loss | error_rate | time |
|---|---|---|---|---|
| 0 | 2.382967 | 3.413582 | 0.875000 | 00:05 |
| epoch | train_loss | valid_loss | error_rate | time |
|---|---|---|---|---|
| 0 | 1.241950 | 1.563377 | 0.708333 | 00:04 |
| 1 | 0.947281 | 0.752443 | 0.312500 | 00:05 |
| 2 | 0.731805 | 0.390660 | 0.166667 | 00:04 |
| 3 | 0.575729 | 0.234377 | 0.104167 | 00:04 |
| 4 | 0.464878 | 0.185962 | 0.062500 | 00:04 |
| 5 | 0.386068 | 0.171123 | 0.062500 | 00:04 |
| 6 | 0.326107 | 0.155518 | 0.041667 | 00:04 |
| 7 | 0.295240 | 0.147135 | 0.020833 | 00:04 |
01:27:06 - Confusion matrix
- Shows you how many you predicted correctly from each class.
- Diagonal are all correct.
interp = ClassificationInterpretation.from_learner(learn)
interp.plot_confusion_matrix()

01:27:42 - Plot top losses
- Show you watch you errors look like: predicted/actual or the predictions model was least confident about.
interp.plot_top_losses(5, nrows=1)

01:28:19 - Getting into production
- Need to export model
- Create new file that contains the architecture and all params of model
- That can be copied to a server and treated as a program
learn.export()
path = Path()
path.ls(file_exts='.pkl')
(#1) [Path('export.pkl')]
Can then load exported model with load_learner
learn_inf = load_learner(path/'export.pkl')
Then make a prediction:
learn_inf.predict('../input/fruit-images-for-object-detection/test_zip/test/apple_77.jpg')
('apple', tensor(0), tensor([9.9949e-01, 2.5578e-06, 4.4289e-04, 6.2133e-05]))