Lesson 1: Intro to Statistical Research Methods
Lesson 1: Intro to Statistical Research Methods
- To have some level of confidence in survey results, you would need to know, at least:
- how many people were surveryed
- who was surveyed
- how the survey was conducted
- Constructs
- Things that are generally difficult to measure precisely eg:
- Happiness
- Hunger
- Health
- Things that are generally difficult to measure precisely eg:
- Operational Definition
- Systems to measure constructs
-
Samples & population
- Average across population is called "population parameter". Denoted by 'mu'
- Within population there's a "sample" of people.
- Average for the sample is called "sample statistics". Denoted by 'x-bar'
- Difference between mu and x-bar is called "sampling error"
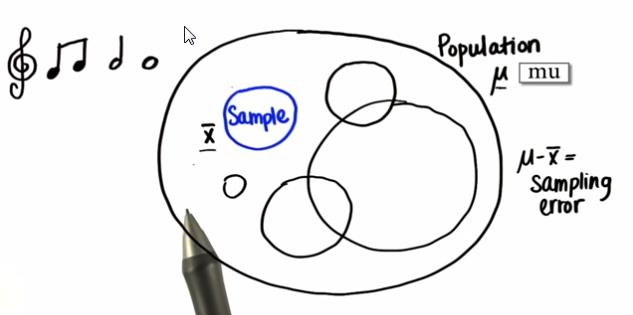
- Obviously, the bigger the sample, the closer the mu is to x-bar population
- Visualize relationship
- Helps to find correlations between data
- Correlation does not imply causation
- "No two countries with a McDonald's have ever gone to war since opening the McDonald's" -- Thomas Friedman
- Casual inference
- To observe pattern between two variables, have to consider "lurking variables"
- To show relationships, you can do observational studies or surveys
- To show causation, you'd need to do a "controlled experiment"
- Downsides to surveys
- Untruthful responses
- Biased responses
- People not understanding the questions or refusing to answer
- Controlled Experiments
- Placebo
- Allows for a comparison 'control group' to the 'experimental group'
- Blind
- Ensures everyone thinks they're the 'experimental group'
- Double blind
- Researchers observing results shouldn't know who's in control or experimental to prevent judgement bias
- Independant variable = variable that is changed to test effect on dependant variables
- Dependant variable = variable being tested