Lesson 10: T-Tests
Lesson 10: T-Tests
First half
-
Basic premise for t-test
- Get the sample mean to compare to the population mean (or alternate sample)
- Find the sample standard deviation
- Use it to calculate t value
t = (mu - sample_mu) / (std_dev / sqrt(n))- Look up t-table to find critical p-value for your alpha level.
- Degrees of freedom = sample_size - 1
- If it's a two-tailed test, then:
alpha level / 2
- Is the t score further away from 0 than the critical probability?
- If so, then it's statistically significant. Or, we reject the null hypothesis
- Determine the sample standard deviation using Bessel's Correction
- S = sqrt( variance / (n - 1) )
- t-distribution
- more prone to error
- more spreadout
- the larger n is (the sample size)
- the closer the t-dist is to normal
- the tails get skinnier
- less margin of error
- Understanding degrees of freedom
- Example: if you have 3 marbles to put in 3 cups
- 1st cup: 3 choices of marbles
- 2nd cup: 2 choices of marbles
- 3rd cup: 1 choice
- Therefore, the last cup is forced, so you have 2 degrees of freedom
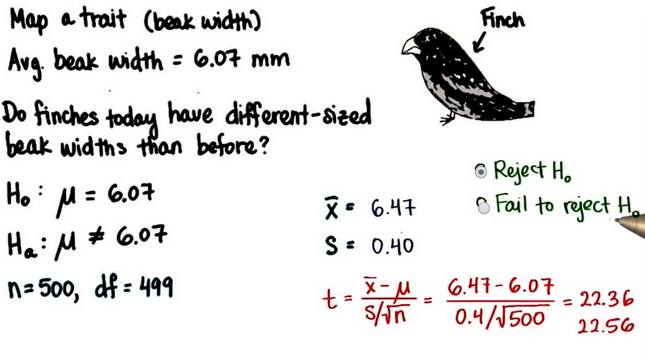
- Finch example (birds)
- Scientists map a trait of the birds like beak width
- Average beak width = 6.07mm
- Do Finches today have different-sized beak widths than before?
- Null = beak width == 6.07mm
- Alternate = beak width != 6.08mm
- Sample size = 500, df = 499
- x-bar = average_of_sample = 6.4696
- Std dev = sqrt(variance(sample)) = 0.4
- t-statistic =
(x-bar - mu) / (Std_dev / sqrt(n))= 22.36 - We can definitely reject the null
 * Cohen's d
* Common measure of "effect" size when comparing means
* Measures the distance between two means in std deviation units
* Instead of dividing by standard error, divide by standard deviation of the sample
* Dependent samples
* "When the same subject takes the test twice"
* Two different treatments
* Pre-test, post-test
* Growth over time (longitudinal study)
* Cohen's d
* Common measure of "effect" size when comparing means
* Measures the distance between two means in std deviation units
* Instead of dividing by standard error, divide by standard deviation of the sample
* Dependent samples
* "When the same subject takes the test twice"
* Two different treatments
* Pre-test, post-test
* Growth over time (longitudinal study)
New half
- Effect Size
- size of treatment effect
- if you have a treatment variable, what's the difference between two means?
- everyday meaning
- variables you can understand without special training
- types of effect size measures
- difference measures
- standardized differences
- Cohen's d
- correlation measures
- r2
- "proportion (%) of variation in one variable that is related to ('explained by') another variable"
- r2
- size of treatment effect
- Statistical significance
- Rejected the null
- Results not likely due to chance (sampling error)
- Cohen's d
- Provides "standardized mean difference"
d = (x-bar - Mu) / std- Interpretation: how far apart the sampling mean is in standard deviations
-
R-squared - r^2 - coefficient of determination
- Result: 0.0 - 1.00
- 0 == variables that are not related
- 1 == variables that are perfectly related (near impossible)
- r^2 =
t^2 / (t^2 + df)Note: t-score is not t-critical value- Example:
- ```t = 2, df = 24 == 4 / (24 + 4) == 0.167
- Result: 0.0 - 1.00
-
Results section