Lesson 2: Visualizing Data
Something | Frequency
India     | 10
China     | 14
England   | 100
- Relative frequency == proportion
- Defined as: frequency / total
- India = 10 / 124 == 0.08
- Always >= 0 and <= 1
- Percent = proportion * 100
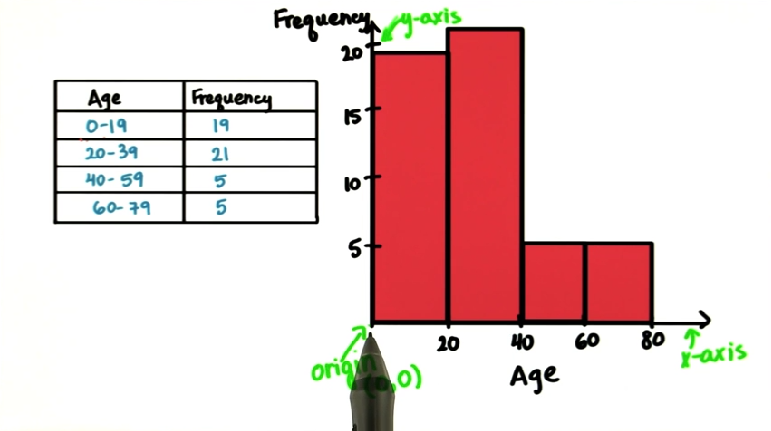
- Histogram
- Interval/bin/bucket
- Grouping things like ages: 0 - 19, 20 - 39, 40 - 59
- Frequency is always y-axis
- Variable is on x-axis
- Bar graph
- Different from histogram, each variable is a distinct value
- x-axis is sometimes categorical rather than numerical/quantitative
- Normal distributions
- Skewed distributions
- Peaks toward left or right