Linear Function
A linear function is represented by a straight line on a graph. It indicates a linear relationship between two variables: when one changes, the other changes at a constant rate. For example:
- The count of floors vs number of windows on a high-rise building.
- The distance travelled vs time at a constant speed.
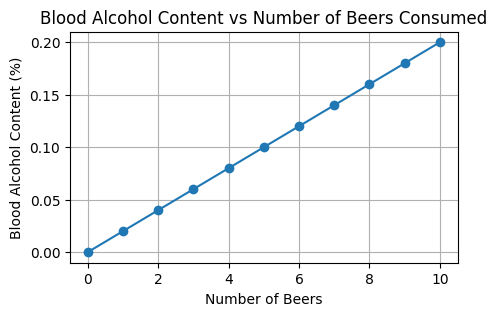
- The number of beers consumed vs blood alcohol content.
The general form of a linear function is: where is the slope of the line and is the intercept.
The slope, , indicates how steep the line is and in which direction it points.
The point is the y-coordinate of the point where the line intercepts on the y-axis, which tells us the value of the function when is zero.