Mel Spectrogram
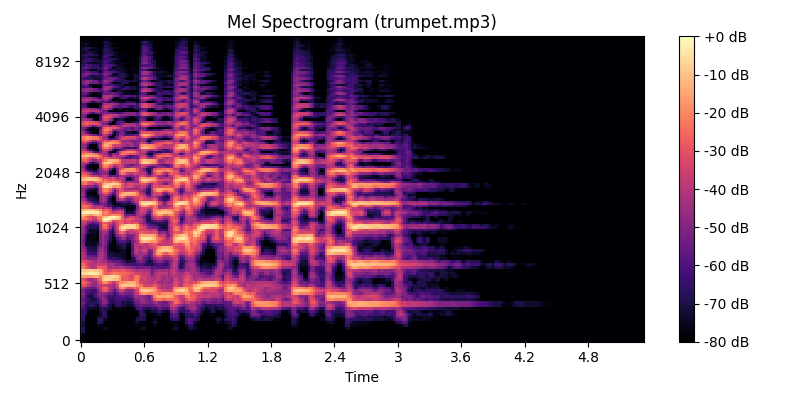
Mel Spectrogram is a graphic representation of a Sound Wave, visualising frequency over time. The difference between a Mel Spectogram and a Spectrogram, is the frequency y-axis is represented using the Mel Scale in the former.
Here is a Mel Spectrogram of the audio of a Trumpet
The process of generating a Mel Spectrogram works like this:
- Break the audio signal down into short frames
- Convert time signal into the frequency domain using a Fourier Transform
- Convert frequencies into Mel scale, to more closely align with our intuition of frequencies. This operation is called Mel Filter Bank.
- Plot the Mel values over time.
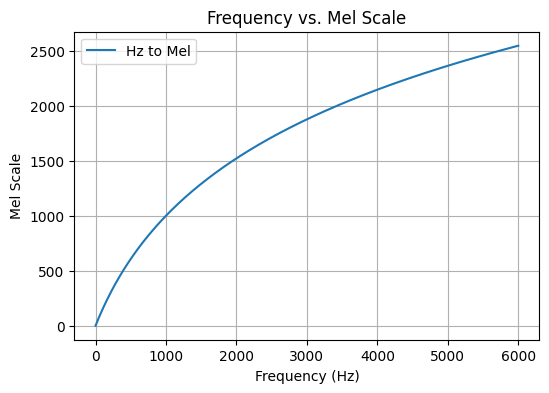
Mel Scale
The Mel Scale is a perceptual scale of audio frequencies. In other words, it represents our perceived distance of the frequencies from others.
The Mel scale is a logarithmic formula where 1000Mel = 1kHz. You can convert Hz to Mel using this formula: