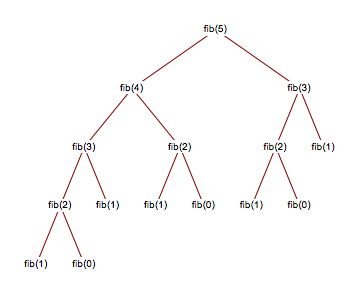
Propositional Logic

A system that deals with statements that are either true or false
A system that deals with statements that are either true or false
Declarative sentences that are either true or false (but not both)
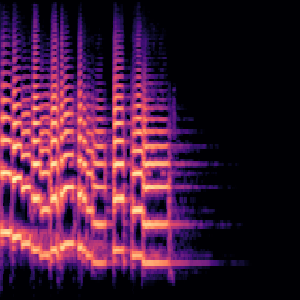
A sound wave visualisation of frequency over time

A measure of how accurately the source signal was digitally represented
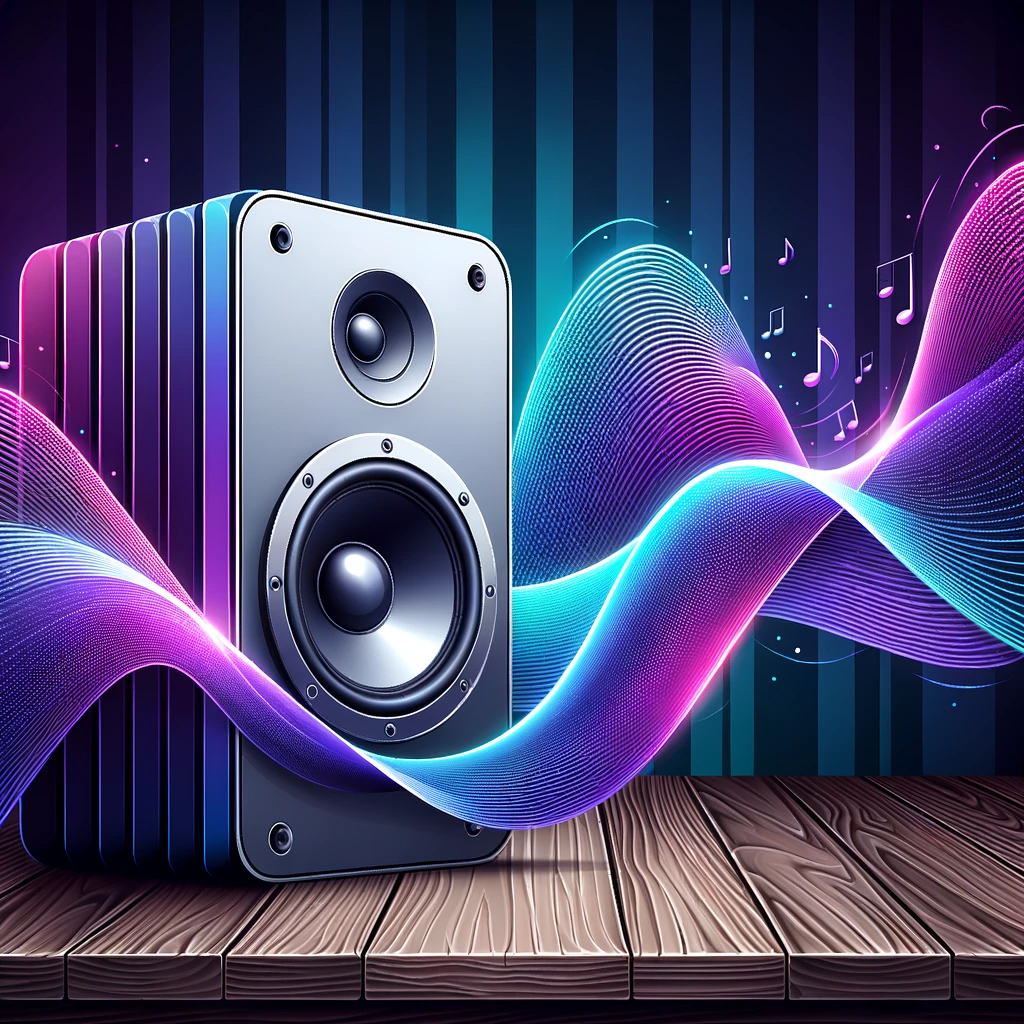
Wave of pressure which our ears can perceive
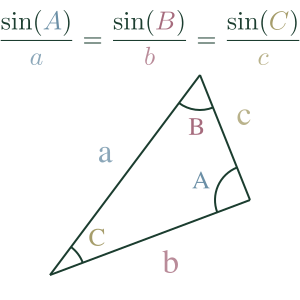
Tells us the ratio between the sine of an angle and the side opposite it will be constant for all angles in a triangle
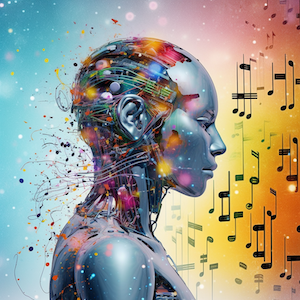
Training a singing voice conversion model on my voice